
Dev House Austria logo Dev House Austria

Data Visualisation Services in Austria

Complex datasets only drive decisions when they are presented clearly and compellingly. Our skilled data engineers across Austria utilise a comprehensive range of visualisation tools to transform raw numbers into actionable insights—accurately identifying market trends, presenting performance metrics, and providing insightful business assessments that drive strategic decisions across the DACH region.

Recognised by the Best

Scope

Data Visualisation Services We Deliver

Managing large volumes of data can be challenging, often delaying project progression and obscuring critical insights. Dev House Austria offers data visualisation services designed to help you effectively manage and interpret your data. Our comprehensive suite of services includes:

Data Visualisation Consulting

Our data consultants help you identify and prioritise the most valuable data sources, enabling cost optimisation across business functions and uncovering innovative solutions hidden within your data.

Data Visualisation Implementation

Dev House Austria implements reliable, user-friendly data visualisation solutions that enable you to extract meaningful information and gain new insights into your target audience, operations, and market position.

Data Platform Development

We develop data visualisation platforms that enable seamless integration from various sources, establish centralised data repositories, ensure robust data protection, and deliver powerful reporting and visualisation capabilities.

Data Visualisation Software Development

Dev House Austria creates bespoke data visualisation solutions tailored to your specific needs, helping your business identify emerging trends and respond swiftly to market changes.

Custom Reports and Dashboard Development

We enhance your business analytics with tailored dashboards and reports that display the key metrics essential for tracking growth and making informed decisions.

Data Analytics and Visualisation Optimisation

Our data engineers refine your existing data management framework by optimising processes, reducing reliance on manual data entry, and improving the accuracy and timeliness of visual outputs.

Technological Stack Expertise

Data Visualisation Tools and Technologies

Dev House Austria is proficient in a wide range of data visualisation tools and technologies, enabling us to transform complex data into clear, actionable insights. Our expertise spans the latest industry-standard tools, ensuring your data is presented in an engaging and comprehensible manner that drives informed decision-making.

BI and Data Visualisation Tools

  • Tableau
  • Google Data Studio
  • Microsoft Power BI
  • Looker
  • QuickSight
  • Qlik Sense
  • QlikView
  • Datawrapper

Languages and Frameworks

Libraries

  • Matplotlib
  • Plotly
  • Seaborn
  • Plotnine / GGplot
  • Bokeh
  • Pygal
  • Geoplotlib
  • D3.js
  • High Charts
  • Chart.js
  • Fusion Charts
  • Chartlist.js
  • Recharts
  • Google Charts

Cloud

DWH Services and Databases

  • Microsoft SQL Server
  • PodtfreSWL
  • MongoDB
  • MariaDB
  • MySQL
  • Cassandra
  • Clickhouse
  • Neo4j
  • Redis
  • Aurora
  • DynamoDB
  • Redshift
  • RDS
  • Snowflake
  • DocumentDB
  • Synapse
  • Cosmo DB
  • Google BigQuery
  • Cloud Bigtable

Data Storage

  • Amazon S3
  • Amazon DynamoDB
  • Amazon DocumentDB
  • Azure Cosmos DB
  • Azure Blob Storage
  • Azure Data Lake
  • Azure Data Factory
  • Google Cloud Datastore
  • Memorystore

Big Data

  • Apache Hadoop
  • Apache Spark
  • Apache Cassandra
  • Apache Kafka
  • Apache ZooKeeper
  • Apache HBase

See Your Data Clearly

Partner with Dev House Austria for visualisation solutions that turn complexity into clarity and drive better business decisions.

Process

Our Data Visualisation Workflow

Dev House Austria tailors our approach to meet each client's unique needs, ensuring the most effective data visualisation solutions. Here is how we manage the data workflow process:

  • 01

    Collect

    We start by gathering all relevant data from your various sources. This data is collated, refined, and captured for structured analysis.

  • 02

    Clean

    Data cleaning is a crucial step that guarantees the quality and accuracy of the final visualisations — removing duplicates, correcting errors, and standardising formats.

  • 03

    Parse

    We structure the primary data, categorising it into meaningful groups and subgroups that reflect your business dimensions.

  • 04

    Filter

    Before finalising, we filter the data to remove unnecessary information, enhancing the clarity and precision of the results.

  • 05

    Visualize

    The processed data is transformed into charts, diagrams, tables, and maps, with templates carefully selected to best represent the information and support decision-making.

  • 06

    Interact

    We engage in feedback and fine-tuning of the visualisations according to your specifications, ensuring they meet your exact requirements.

Cost

What do data visualisation services cost?

The cost of data visualisation services varies based on your specific needs and project complexity. Factors influencing pricing include the tools employed, required functionality, implementation timeline, and team composition. Dev House Austria delivers competitive rates with DACH-based project management and the quality standards expected by Austrian enterprises.

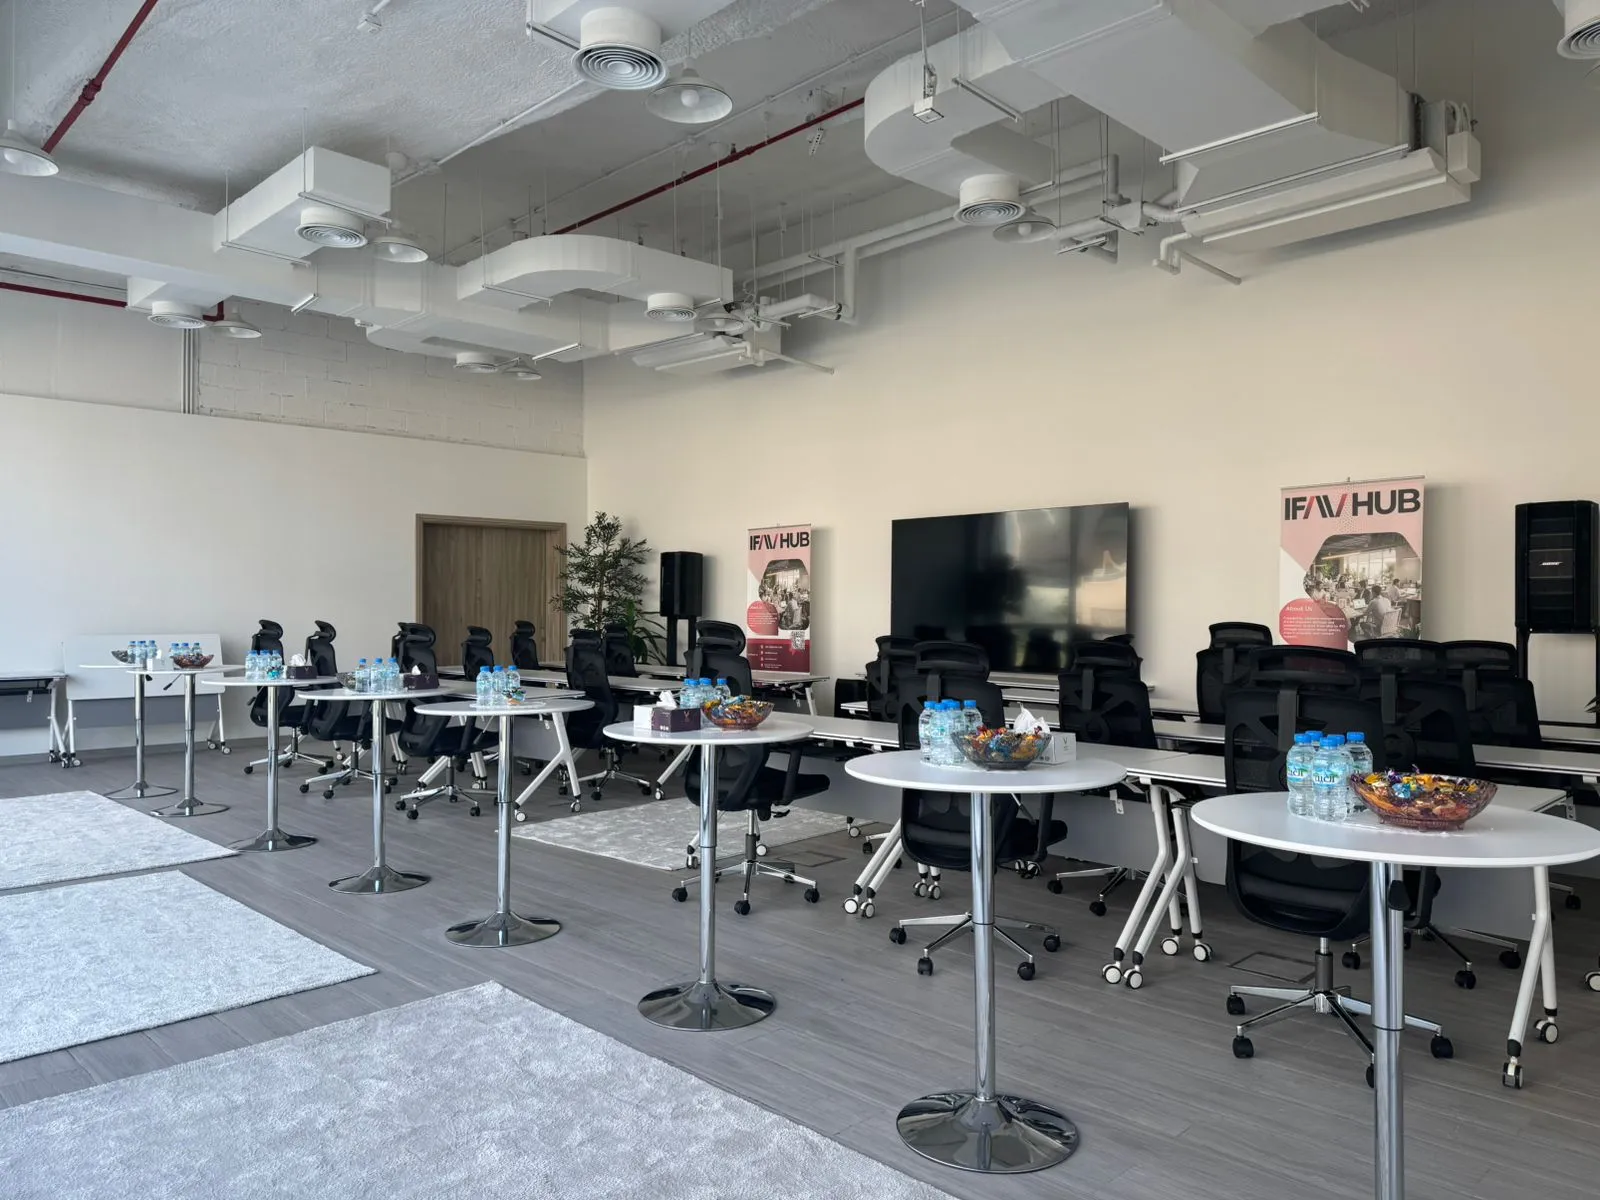
IFAVH - Austria

IFAVH - Austria

A next-generation startup ecosystem platform integrating incubation, acceleration, investor networking, and company-formation services in a unified system.

Browse all Case Studies

What Our Clients Say

"Our managers who interact with Dev House Austria are all in agreement that this is an outstanding company. They are meticulous, patient, and extremely capable."

Jim Murray

Operations Director at Prosperity.ie

"Dev House Austria has constantly under-promised and over-delivered. We couldn't be happier with their professionalism, confidentiality, and attention to detail."

Anonymous

Chief Executive Officer at SaaS Company

"There were no delays. They presented things quickly to me. They were very good and up-to-date with their technology."

Edel McDonnell

Owner at KingFisher Restaurant

"They always look for alternative ideas to enrich value. They are disciplined, keep meetings on track, and provide detailed updates."

Fintan Knight

Chief Executive Officer at Automotive Equity Management Ltd.

"What impressed us most was their commitment to delivering an excellent result. The commitment was extraordinary from the first day."

Bob Khanna

Office Manager at Aesthetic Clinic

Clutch Clutch Review

FAQs

  • Answer: Data visualisation converts large volumes of data from various sources into intuitive formats like charts, graphs, and maps. These visual representations can be easily customised to suit specific user needs, making complex data immediately understandable and actionable.

  • Answer: The human brain processes visual information significantly faster than textual data. Visualisation reports provide clear insights at a glance, enabling more informed and faster decision-making — particularly valuable in fast-moving DACH business environments.

  • Answer: The development timeline depends on data complexity, the volume of data sources, the specific timeframe you wish to visualise, and the level of interactivity and customisation required.

  • Answer: Data visualisation tools help businesses quickly identify patterns, trends, and insights within large datasets. They enable teams to present findings in a visually engaging way, making it easier to communicate results to stakeholders and support data-driven decisions.

  • Answer: Data visualisation plays a crucial role in predictive analytics by illustrating potential future trends based on historical data. Visual representations of predictive models allow businesses to anticipate outcomes, assess risks, and develop effective strategies.

Contact Us!

Fill out the form below or schedule a call and we will be in touch. * indicates a required field.

Remaining Characters: 10000

By clicking Send, you agree to our Privacy Policy.

Offices

One Company.
Six Regional Offices.

Local leadership. Global engineering excellence. Delivering software solutions across Europe and Asia-Pacific.

Book a call
Lakeside view of Hallstatt, Austria

Austria

Vienna

Currently Viewing
Abu Dhabi skyline at sunset, United Arab Emirates

UAE

Abu Dhabi

Chicago skyline at golden hour, Illinois

USA

Chicago